06/05/2025 pre-market
Now let us understand what this chart is telling us. When advances over 8 days exceed the number of declines and we see that volume moves up or down over that period, we can explain how the buyers or sellers are driving the market.
On the last day (left graph) 25.61% of all the stocks advanced 40.06% declined.
The Chart shows advances vs. declines over the last 8 trading days. We also show advances over declines bars over 10 weeks (see chart on the right).
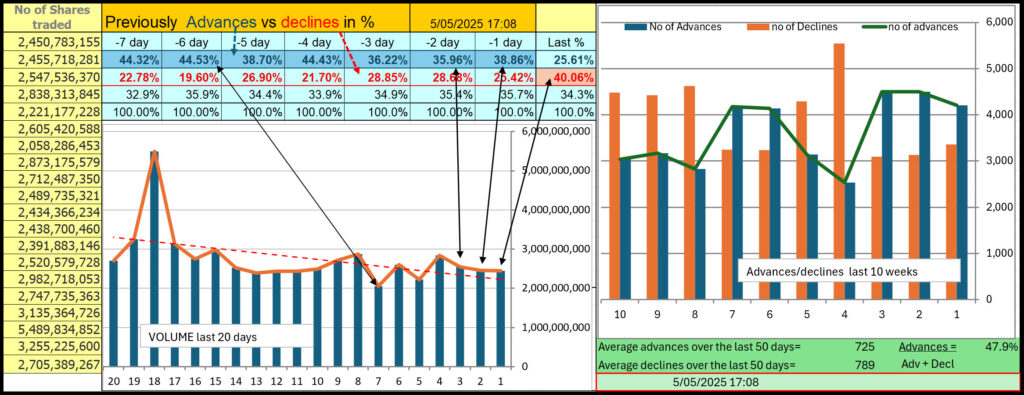
Over the previous five days, Buyers collectively drove the market UP (graph on the right, each bar representing five days). Statistically, over 50 days 47.9% from 48.1% from 47.3% from 49.3% of total trades showed advances. THE MARKET has tilted towards Buyers during the last 3 week(s). And in the chart on the left 7 day(s) in the previous 10 trading days had more advances (highlighted in Blue), and 1 day(s) had shown declines (highlighted in red).
28/04/2025 pre-market
Now let us understand what this chart is telling us. When advances over 8 days exceed the number of declines and we see that volume moves up or down over that period, we can explain how the buyers or sellers are driving the market.
On the last day (left graph) 44.53% of all the stocks advanced 19.6% declined.
The Chart shows advances vs. declines over the last 8 trading days. We also show advances over declines bars over 10 weeks (see chart on the right).
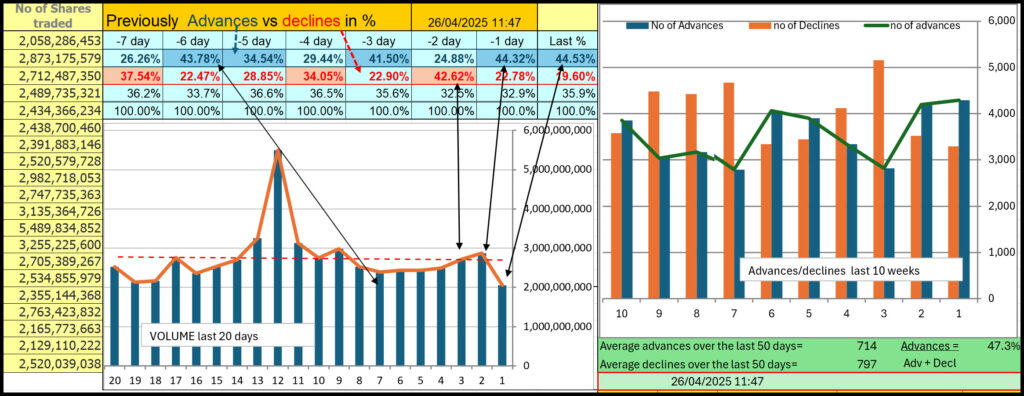
Over the previous five days, Buyers collectively drove the market UP (graph on the right, each bar representing five days). Statistically, over 50 days 47.3% from 49.3% from 48.2% from 49.9% from 48.7% of total trades showed advances. THE MARKET has tilted towards Buyers during the last 2 week(s). And in the chrte on the left 5 day(s) in the previous 10 trading days had more advances (highlighted in Blue), and 3 day(s) had shown declines (highlighted in red).
22/04/2025 pre-market
Now let us understand what this chart is telling us. When advances over 8 days exceed the number of declines and we see that volume moves up or down over that period, we can explain how the buyers or sellers are driving the market.
On the last day (left graph) 30.36% of all the stocks advanced 32.39% declined.
The Chart shows advances vs. declines over the last 8 trading days. We also show advances over declines bars over 10 weeks (see chart on the right).
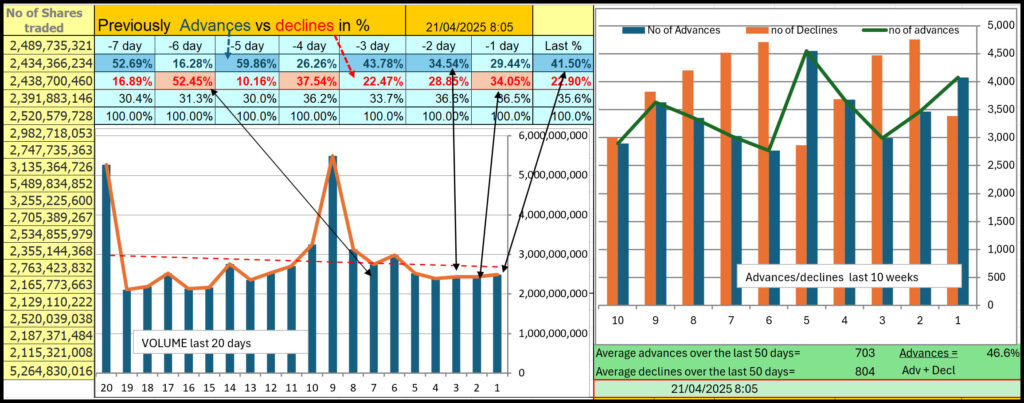
Over the previous five days, Buyers collectively drove the market UP (graph on the right, each bar representing five days). Statistically, over 50 days 49.3% from 48.2% from 49.9% from 48.7% of total trades showed advances. THE MARKET has tilted towards Buyers during the last 1 week(s). And in the chrte on the left 4 day(s) in the previous 10 trading days had more advances (highlighted in Blue), and 3 day(s) had shown declines (highlighted in red).